
Why Most S/4HANA Migrations Miss Their Budget and Timeline, and How to Improve the Odds
 Orpington Technologies | SAP S/4HANA Migration Insights
© Orpington Technologies Inc.
www.orpingtontech.com
Orpington Technologies | SAP S/4HANA Migration Insights
© Orpington Technologies Inc.
www.orpingtontech.com
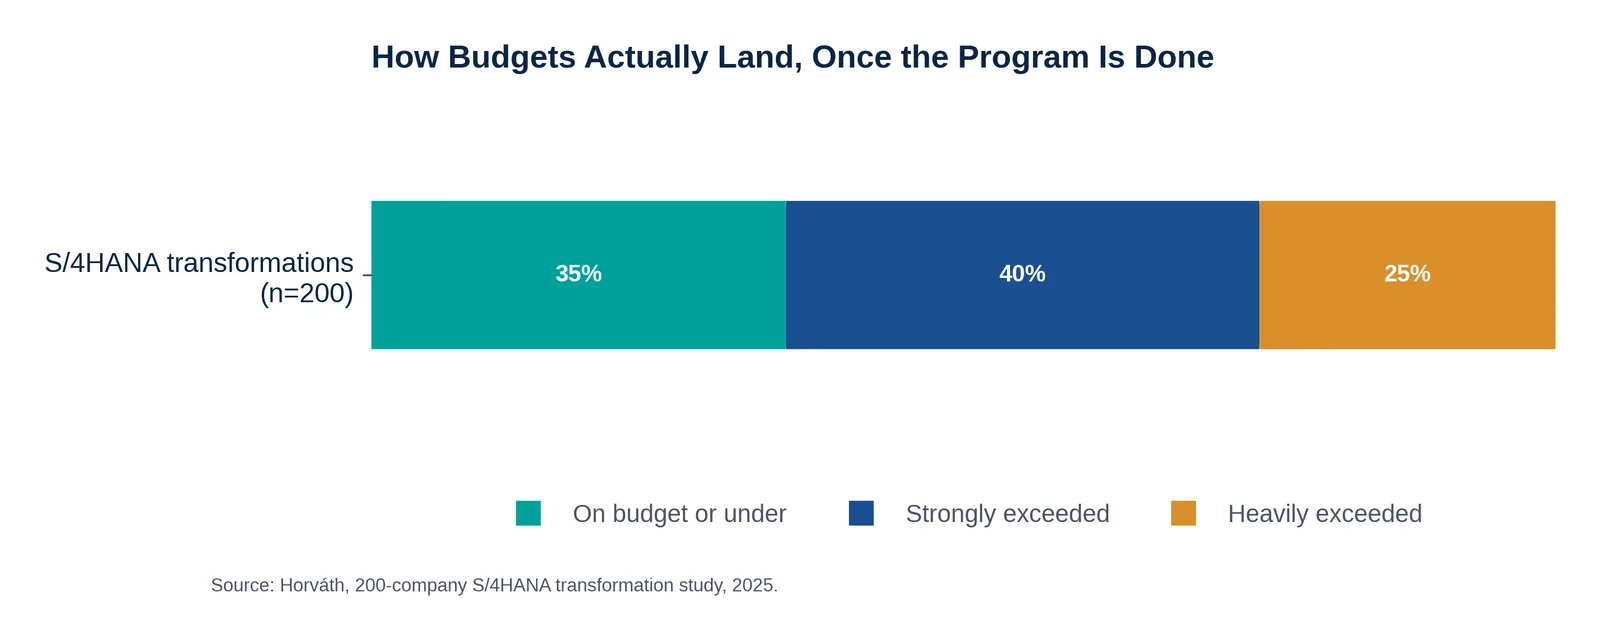
The scale of the problem is well documented, and not by just one study. Horváth's 2025 research found that 65% of S/4HANA transformations experience significant budget deviations: 25% heavily exceeding budget, 40% strongly exceeding it, with only 35% landing on budget or under. Gartner's broader estimate puts the ERP project failure rate, defined as failing to meet original objectives, at 55–75%. Rand Group, an implementation consultancy, reports that 60% of the new clients who come to them arrive after a failed or subpar implementation with a different provider.
Prosci's 2025 research adds a forward-looking data point that explains why risk scoring has become a priority: Gartner projects that more than 70% of recently implemented ERP initiatives will fail to fully meet their original business case by 2027. That figure isn't retrospective. It's a projection about programs that are, in many cases, still underway right now.
Budget outcomes across a 200-company sample of S/4HANA transformations.
What Predictive Risk Scoring Actually Does
Predictive risk scoring works by treating the program itself as a data source, rather than relying solely on manually updated RAG (red-amber-green) status reports. The discipline draws on the actual telemetry a migration program generates: defect discovery and closure rates in the test-management system, the ratio of open to resolved fit-gap items, resource utilization against plan, the velocity of change requests, and, where available, patterns from comparable historical projects that ended up over budget or behind schedule. Much of the current tooling applies AI-assisted models to weigh those signals, but the underlying method, evidence in place of self-report, predates any particular modeling approach.
The output isn't a single dashboard color. It's typically a risk score by workstream, updated continuously as new data lands, with the specific combination of signals driving the score made visible rather than buried in a black box. A testing workstream where defect discovery is accelerating faster than defect closure is a good example: that's a leading indicator a program often doesn't surface through manual reporting until the test exit criteria are formally missed, weeks later.
Page 2 of 4